How the Airbnb Algorithm Works: Get More Bookings
TL;DR
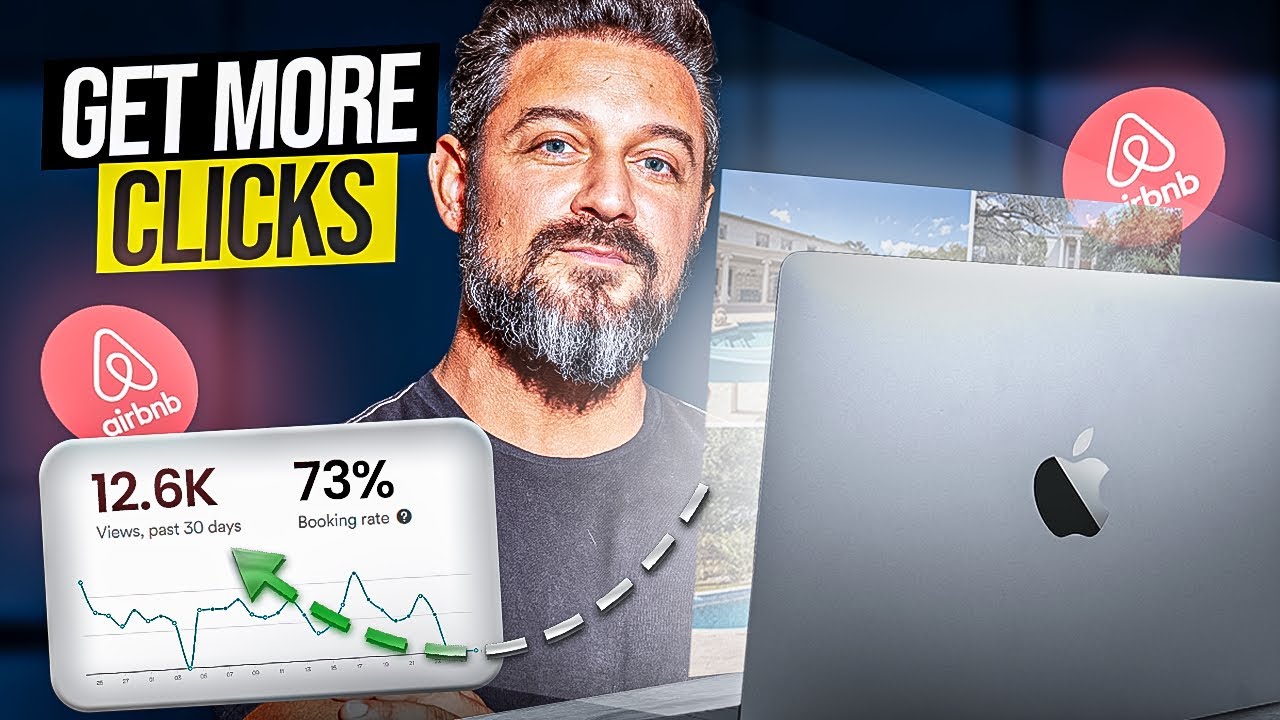
Sean Rakidzich explains how the Airbnb algorithm works to help hosts increase bookings by focusing on matching guests with the right property through a process called "right fitting."
The article highlights that a 4.9-star listing outperforms a popular 3.8-star one, emphasizing that ratings matter more than clicks for algorithmic ranking.
Sean recommends improving all aspects of the guest experience, including response time, cleanliness, and reviews, to ensure long-term success beyond the initial listing boost. By Sean Rakidzich, 155-property operator. Strategy session at rakidzich.com/book.
Key Facts
| Listing Type | Monthly Clicks | Rating | Search Rank | Nightly Rate |
|---|---|---|---|---|
| High Clicks, Low Rating | 500 | 3.8 stars | Going Down | $150 |
| Lower Clicks, High Rating | 200 | 4.9 stars | Going Up | $185 (+23%) |

Image: Dllu, via Wikimedia Commons, CC BY-SA 4.0
 18:43
18:43
Watch the video above to see Sean Rakidzich break down the Airbnb algorithm in action, then read on for the complete guide with detailed strategies.
- There are 1.76 million Airbnb listings in the US (AirDNA 2025). You need to stand out to get bookings.
- The algorithm matches guests to places they will like. It looks at many things at once, not just one.
- Answer 90% of messages within 24 hours to become a Superhost and rank higher.
- Dynamic pricing can boost your income 15-40% (PriceLabs 2025) compared to keeping the same price.
- Good photos get 40-60% more clicks. Spend $200-400 on professional photos.
- Ratings matter more than clicks. A 4.9-star listing beats a popular 3.8-star one.
How the Algorithm Has Changed
Image via Amenitiz
Active Airbnb listings in the US as of 2025 (AirDNA Market Data). Standing out is harder than ever.
The Airbnb algorithm has changed a lot. It used to just look at price and photos. Now it looks at many things at once.
This new system is called "right fitting." It tries to match guests with places where they will be happy.
With nearly 2 million listings in the US alone, you need to do many things well. You cannot just focus on one thing anymore.
The algorithm looks at everything: how fast you reply, your ratings, how many people book after viewing, and what guests say in reviews. You need to be good at all of these, not just one.
What is Right Fitting
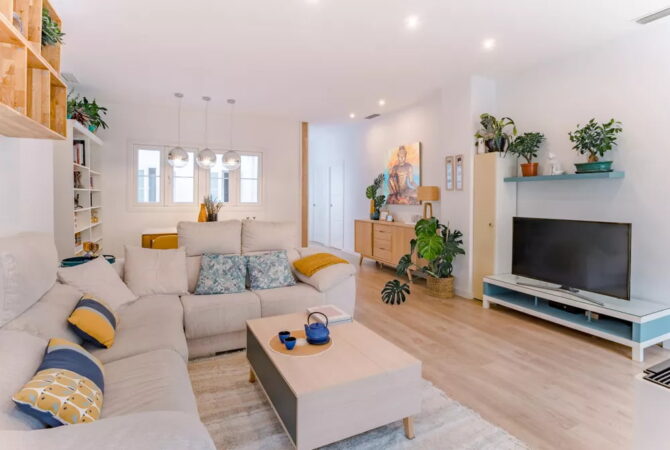
Image via Extra Space Storage
Right fitting is how Airbnb matches guests with places they will like. Think of it like a dating app for travel.
The algorithm looks at what guests have booked before. It looks at what they search for. It even looks at which stays made them happy.
What the Algorithm Checks
For hosts, it checks these things:
- Response time: Do you reply to at least 90% of messages within 24 hours? This is needed for Superhost status.
- Ratings: Your overall score and what guests say
- Conversion rate: How many people who view your listing actually book
- Reviews: What words guests use to describe their stay
This creates a loop. Hosts who make guests happy get shown to more people. More bookings mean more chances to make guests happy. The good get better.
You must be good at many things, not just one. Great photos alone will not save you if your reviews are bad. Fast replies will not help if your place is dirty.
How to Use Right Fitting
Start by looking at every step of the guest experience. From first message to checkout, find where things go wrong.
- Make check-in easy: Remove extra steps. Give clear directions.
- Send personal messages: Use their name. Remember what they told you.
- Create a house guide: Answer questions before guests ask them.
Watch your numbers over time. See which changes help your bookings and ratings.
"Right fitting is the single most important concept to understand. The algorithm is not trying to get clicks - it is trying to match the right guest with the right property. When you understand this, everything else makes sense."
How Listings Get Found
Airbnb wants listings that make guests happy, not just ones that get clicks.
Some hosts focus only on eye-catching photos. But if guests arrive and the place does not match the photos, they leave bad reviews.
Bad reviews hurt you in two ways:
- The algorithm shows you to fewer people
- People who do see you are less likely to book
Good reviews help you in two ways:
- The algorithm shows you to more people
- People who see you are more likely to book
Focus on making guests happy first. The clicks will follow. A listing with modest traffic but great reviews beats a popular listing with bad reviews every time.
The New Listing Boost Trap
Days of extra visibility when you first list (Airbnb Resource Center). After that, you are on your own.
When you first list on Airbnb, you get a boost. The algorithm shows your listing to more people for 30 to 60 days.
This helps new hosts get their first reviews. But it can trick you into thinking things are going great.
The trap: Some hosts do well during the boost and think they have it figured out. Then the boost ends and bookings drop. They keep doing the same things that worked before, but now they do not work.
Do not rely on the new listing boost. Use those first 30 days to build good habits. Track how you do without the boost so you know what to expect later.
"The new listing boost is like training wheels. It feels great when you have it, but you need to learn to ride without it. I have seen too many hosts crash when those training wheels come off because they never built the fundamentals."
Ratings and Money
High clicks but low ratings will hurt you. If many people click on your listing but leave bad reviews, the algorithm will show you less over time.
What You Need for Superhost
Superhost status shows guests you are trustworthy. It also helps you rank higher. Here is what you need:
- 4.8 or higher rating (really 4.75 because of how rounding works)
- At least 10 stays
- 90% response rate within 24 hours
- Less than 1% cancellations
Higher rates that top-rated properties can charge compared to average ones (AirDNA Market Analysis).
Why Ratings Beat Clicks
Here is an example. Imagine two listings:
| Listing Type | Monthly Clicks | Rating | Search Rank | Nightly Rate |
|---|---|---|---|---|
| High Clicks, Low Rating | 500 | 3.8 stars | Going Down | $150 |
| Lower Clicks, High Rating | 200 | 4.9 stars | Going Up | $185 (+23%) |
The 4.9-star listing wins. It ranks higher, gets more bookings, and charges more per night.
Focus on the Right Things
- First, make sure your check-in is easy
- Next, make sure your place is very clean
- Then, make sure you reply to messages fast
- After you get good reviews, work on better photos
Photos and Titles That Work
Why Photos Matter So Much
People decide if they like your listing in less than a second. Good photos can change everything.
More clicks from search results when you have professional photos (Airbnb Photo Guide).
Professional photos cost $200 to $400. That sounds like a lot. But listings with good photos can often charge $10 to $20 more per night.
Do the math: If you charge $15 more per night and book 20 nights in the first month, that is $300 extra. The photos paid for themselves.
What Good Photos Do
- 40-60% higher click rate from search results
- 20-30% higher booking rate from people who click
- Full payback in 2-4 months for busy listings
Keep Photos Fresh
Update your photos for different seasons. A cozy winter photo with a fire works great in January. A sunny summer shot works better in June.
Photo Action Steps
- Take photos in different seasons
- Change your main photo every 3 months
- Look at what other listings in your area show
- Pick angles that make you stand out
Writing Good Descriptions
Help Guests Imagine Their Stay
Good writing makes guests feel something. It helps them picture themselves at your place.
Use words that describe what guests will see, hear, and feel. This works better than just listing facts.
Instead of: "Nice bedroom with comfortable bed"
Try this: "Sink into soft cotton sheets as morning light comes through the windows."
Mix Story and Facts
The best listings do both. They tell a story that makes guests excited. They also list the facts guests need.
Some guests book on feeling. Others need to check every detail. Give them both.
Writing Checklist
- Use "you" instead of "I" or "we"
- Add words about what guests will see, hear, and feel
- List amenities by room
- Make sure photos match your words
Smart Pricing Tips
Why Dynamic Pricing Works
More money earned by hosts who use dynamic pricing tools. Source: PriceLabs Global Host Report
Dynamic pricing means your price changes based on demand. When lots of people want to book, your price goes up. When fewer people want to book, your price goes down.
Tools like PriceLabs do this automatically. They watch what is happening in your market and change your price.
What These Tools Look At
- Other listings nearby: Are they booked or empty?
- Search demand: Are lots of people searching for your area?
- Past patterns: When do people usually book your area?
- Local events: Is there a big concert or conference coming?
Example: A big conference comes to your city. The pricing tool sees lots of searches. It raises your price within hours. If you set your price by hand, you might miss this chance.
Watch Your Competition
Check what other listings near you are doing:
- If 70% or more are booked: Raise your price 5-10%
- If 50% or more are empty: Lower your price 3-5%
- If it is mixed: Keep your current price
This stops two big mistakes: pricing too high when no one is booking, and pricing too low when everyone wants to stay.
"Dynamic pricing is not about charging more - it is about charging the right amount at the right time. When you leave money on the table during peak demand, you are subsidizing guests who could afford to pay more."
Creating Great Experiences
What Guests Remember
Guests book based on what they imagine doing. They picture themselves using your kayaks. They imagine gathering around your fire pit.
This is why experience amenities often matter more than fancy finishes.
More impact on family booking decisions from experience amenities (kayaks, games) versus luxury finishes (Airbnb Guest Experience Guide).
Experience vs Luxury
Experience amenities that families love:
- Kayaks and paddleboards
- Fire pit
- Board games
- Outdoor games (cornhole, bocce)
Luxury finishes that matter less:
- Granite countertops
- Designer furniture
- High-end appliances
This does not mean luxury is bad. It just means families choosing between two listings will pick the one with kayaks over the one with fancy counters.
Find What Your Guests Want
- Ask past guests what they used most
- Ask within 3 weeks of checkout while they remember
- Add more of what they loved
- Skip expensive upgrades they did not care about
Rules and Costs to Know
Airbnb success depends on more than just hosting skills. You also need to follow rules and plan your money.
Local Rules
Some cities do not allow short-term rentals. Big cities like New York, San Francisco, and others have strict rules.
Fines can be big. New York charges up to $5,000 for a first offense. Some places charge over $10,000 for repeat problems.
Check your local laws before you list.
Taxes
You may need to pay:
- Occupancy taxes: Usually 3-15% depending on where you are
- Income taxes: You must report what you earn
- Business licenses: Some cities require these
Talk to a tax expert. Missing taxes can wipe out your profits.
Insurance
Your regular home insurance may not cover short-term rentals. If something goes wrong, you could be in trouble.
Special short-term rental insurance costs $1,000 to $3,000 per year. This protects you if a guest gets hurt or damages your property.
Real Costs
About one-third of your money goes to expenses. Here is what that looks like:
| Monthly Income: $3,000 | Percent | Amount |
|---|---|---|
| Operating costs | 33% | $1,000 |
| Cleaning and supplies | 20% | $600 |
| Platform fees | 13% | $400 |
| What you keep | 34% | $1,000 |
Plan for this. If you think you will keep all $3,000, you will run out of money.
How to Track Your Progress
Check these four numbers every month to see how you are doing:
| What to Track | First 3 Months | After 6 Months | Warning Sign |
|---|---|---|---|
| Occupancy Rate | 50% | 65% | Below 40% |
| Nightly Rate | Market average | Market average | 20%+ below others |
| Review Score | 4.8+ stars | 4.8+ stars | Below 4.5 |
| Response Rate | 90%+ in 24hrs | 90%+ in 24hrs | Below 90% |
Average US occupancy is 48-56% (AirDNA 2025). If you are below 40%, something is wrong with your pricing or listing.
If you miss two or more targets by month 3, the problem is usually your pricing, photos, or how you run things.
Your Action Plan
Here are the three most important things to do:
Start Today
- Answer messages fast: Reply to 90% within 24 hours. Turn on phone alerts. Make saved replies for common questions. Have someone cover for you when you travel.
- Rewrite your description: Use "you" instead of "I." Add words about what guests will see and feel. Help them picture their stay.
- Get professional photos: Spend $200-400. Update them each season. Change your main photo every few months.
If You Can Only Do One Thing
Check your response rate first. If it is below 90%, fix that before anything else. You cannot be a Superhost without it, and the algorithm will hide you from searches.
The Big Picture
Hosts who do all three things well see their occupancy go up 15-25 percentage points compared to hosts who focus on just one thing.
Master these basics and you will build a rental business with repeat guests and steady good reviews.
"Here is what I tell every new host: do not chase shortcuts. The algorithm rewards consistency. Focus on responding fast, keeping things clean, and pricing smart. Do those three things for six months and you will outrank hosts who have been doing this for years."
Common Questions About the Airbnb Algorithm
How does the Airbnb algorithm work in 2026?
The Airbnb algorithm uses a system called right fitting. It matches guests with places they will like. It looks at how fast you reply to messages (you need 90% within 24 hours for Superhost), your ratings, how many people book after viewing, and what guests say in reviews. It checks many things at once, not just one thing.
What is the new listing boost on Airbnb?
When you first list on Airbnb, you get extra help showing up in searches for 30 to 60 days. This is called the new listing boost. It helps new hosts get their first reviews and bookings. But do not count on this boost lasting. Build good habits from day one.
How much more money can dynamic pricing make?
According to PriceLabs, hosts who use dynamic pricing tools make 15 to 40 percent more money than hosts who keep the same price all the time. The biggest gains happen during busy times when the tool raises your price automatically.
What rating do I need to become an Airbnb Superhost?
To become a Superhost, you need a 4.8 or higher rating (really 4.75 because of rounding). You also need at least 10 stays, answer 90 percent of messages within 24 hours, and cancel less than 1 percent of bookings. Meeting these standards helps you show up higher in searches.
Quick Checklist: Boost Your Airbnb Ranking
Use this checklist to make sure you are doing the most important things:
Tip: Print this page to use as a reference while you work on your listing.
Want More Airbnb Strategies?
Join 300,000+ hosts learning to build profitable short-term rental businesses. New videos every week on algorithms, pricing, and scaling.
Subscribe to Airbnb AutomatedAbout the Author
This analysis is by Sean Rakidzich, an 11-year short-term rental operator who manages 155 Airbnb properties generating $1M+/month in revenue. Sean has trained 5,000+ students across 76 countries with $1.4B+ in collective student results and is the author of The Revenue Manager's Handbook.
For Sean's framework on the Airbnb algorithm works to help hosts increase bookings by focusing on matching guests with the right property through a process called "right fitting.", see his full content library at rakidzich.com or book a 30-minute strategy session at rakidzich.com/book.
Affiliate disclosure: Some links on this page (anything starting with rakidzich.com/p/) are affiliate links. If you sign up through them, Sean may earn a commission at no extra cost to you. The recommendation reflects Sean's actual use across his 155-property portfolio.
Sources and References
Official Airbnb Documentation
- Airbnb Help Center: How to Become a Superhost - Official Superhost requirements including 4.8+ rating, 90% response rate, and less than 1% cancellation rate
- Airbnb Help Center: Response Rate and Response Time - Official rules for message response timing
- Airbnb Resource Center: How Airbnb Search Works - New listing boost duration (30-60 days) and ranking factors
- Airbnb Resource Center: Photo Guide - Impact of professional photos on click-through rates
- Airbnb Resource Center: Guest Experience Guide - Experience amenities and guest satisfaction
Industry Research and Market Data
- PriceLabs: Global Host Report 2025 - Research showing 15-40% revenue increase from dynamic pricing tools
- AirDNA: 2025 US Short-Term Rental Market Data - 1.76 million active US listings, occupancy rates (48-56% average), and pricing premiums for top-rated properties (10-25%)
- AirDNA Blog: Market Analysis - Ongoing market trends and performance benchmarks
Pricing and Revenue Tools
- PriceLabs - Dynamic pricing software for short-term rentals
Expert Sources
- Sean Rakidzich - Airbnb Automated YouTube Channel - 300,000+ subscribers, short-term rental strategy and market analysis
- Rakidzich.com - Official website with courses and resources
Regulatory Information
- NYC Short-Term Rental Registration - New York City regulations and fines (up to $5,000 for first offense)