Airbnb Revenue Management: The Complete Guide to Maximizing STR Income in 2026
TL;DR
Sean Rakidzich finds that Airbnb revenue management, which focuses on RevPAR rather than ADR, can lead to a 22% revenue increase for hosts who adopt the system.
The article compares a host with a $300 ADR and 40% occupancy to one with a $180 ADR and 75% occupancy, showing the latter earns more due to better RevPAR management.
Sean recommends tracking RevPAR as the key metric to optimize pricing decisions and improve overall revenue performance. By Sean Rakidzich, 155-property operator. Strategy session at rakidzich.com/book.
Key Facts
| Framework | Focus | Link |
|---|---|---|
| Pricing Zones | Calendar-based pricing by booking horizon | Read more |
| ADR Rulesets | Conditional pricing rules for software | Read more |
| The Conversion Equation | Diagnosing views vs conversion problems | Read more |
| The Ramp-Up Phase | New listing launch strategy | Read more |
| RE:Algorithm | Airbnb algorithm mastery | Read more |
| Target Price | Math-based nightly rate system | Read more |
| Pricing Masterclass | Complete pricing system (13 modules) | Read more |
| BIG DATA | Market research before investing | Read more |

Image: Terragio67, via Wikimedia Commons, CC BY-SA 4.0
Revenue increase a host can see when they stop managing by ADR and start managing by RevPAR. I see this pattern play out across the 155 properties I manage. The number is not the point. The system behind it is.
- Airbnb revenue management is a system, not a single decision. It covers base rates, pricing zones, demand events, length of stay, and booking pace.
- RevPAR is the only metric that matters. It accounts for both your nightly rate and your vacancy. ADR alone hides the truth.
- Your comp set determines your base rate. The right base rate comes from what guests pay for similar listings, not what you hope to charge.
- Three pricing zones control your calendar. Far future, medium range, and last minute each need a new plan.
- Length of stay is a hidden revenue lever. Short stays cost more per dollar earned. Long stays can block better bookings. The right balance depends on your guest type.
What Airbnb Revenue Management Means

Image via FourWeekMBA
Most hosts think Airbnb revenue management means raising or lowering prices. It is more than that. Airbnb revenue management is the practice of selling the right room, to the right guest, at the right price, at the right time.
Hotels have used this system for decades. Airlines built entire departments around it. Airbnb hosts are just now catching up. The good news is you do not need a team. You need a framework. That is what this guide gives you.
Airbnb revenue management is not about guessing. It is about using data to make pricing decisions across your entire calendar. You look at demand, competition, booking pace, and seasonality. Then you set rules that adjust your rates on its own.
The difference between a host who earns $3,200 per month and one who earns $4,100 per month from the same property is not location or photos. It is how they manage their calendar over time. One reacts. The other has a system.
Think of it this way. A host who sets one price and leaves it there is leaving money on the table every single day. Some days the price is too high and the night goes unbooked. Other days the price is too low and the guest would have paid more. Airbnb revenue management fixes both problems.
This is yield management applied to vacation rentals. The tools exist. The data is available. You just need to know how to use them.
When I started managing STR properties, I made the same mistake most hosts make. I picked a price that felt right and left it. Some months were great. Other months I had empty nights I could not explain. The shift happened when I stopped thinking about price and started thinking about revenue. Price is one input. Revenue is the output. Revenue management is the system that connects them.
The rest of this guide breaks down each part of that system. We start with the metric that matters most. Then we cover how to find your rivals, set your base rate, build your pricing zones, respond to demand events, and use length of stay as a lever. For a deeper look at the pricing side, see the full pricing strategy guide.
The One Metric That Changes Everything: Airbnb Revenue Management by RevPAR
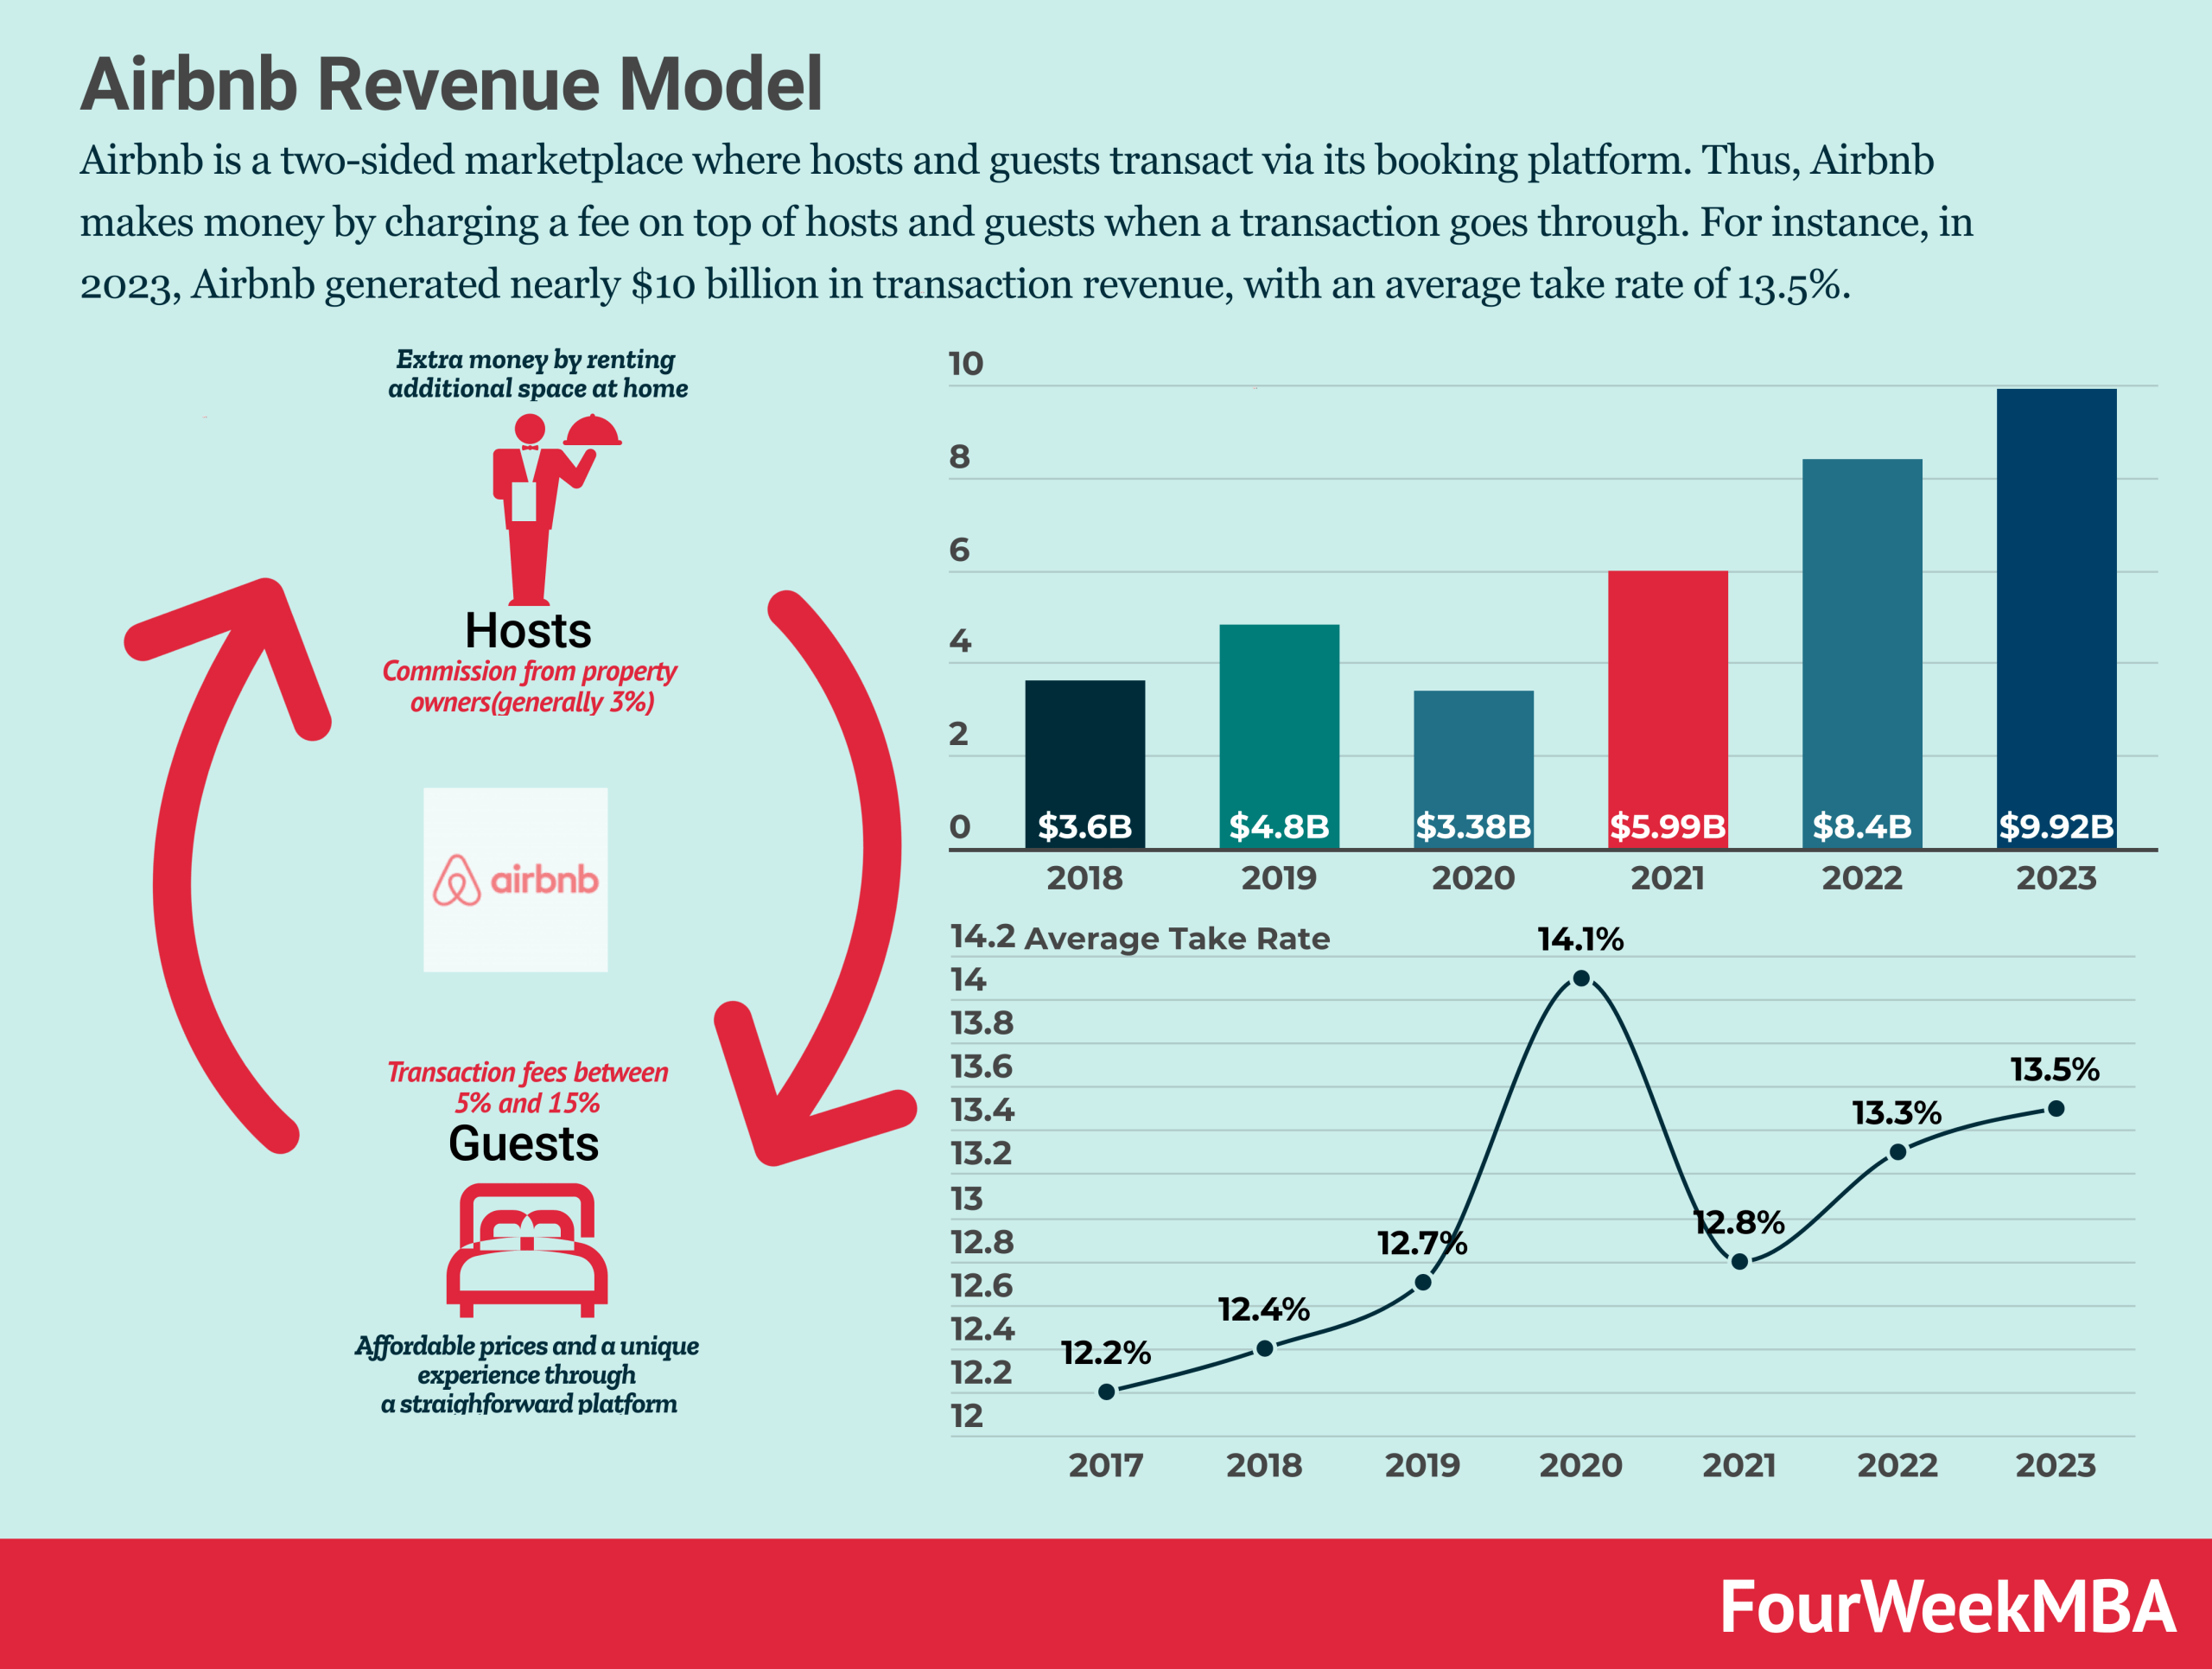
Image via FourWeekMBA
Most hosts track ADR. That stands for Average Daily Rate. It tells you the average price per booked night. It sounds useful. It is not enough.
The metric that matters is RevPAR. That stands for Revenue Per Available Room. It is your total revenue divided by the number of nights your listing was available. Not the nights it was booked. All the nights.
Here is why that matters. ADR ignores your empty nights. A host with a $300 ADR and 40% occupancy looks great on paper. But they are making less money than a host with a $180 ADR and 75% occupancy.
$180 x 75% x 30 = $4,050. $300 x 40% x 30 = $3,600. Same market. Different systems. The host with the lower nightly rate earns $450 more per month because they manage by RevPAR, not ADR.
Here is a simple example. Your listing earned $3,000 in a 30-day month. Your RevPAR is $100 per day. ($3,000 divided by 30 = $100.) That number tells you the truth about your performance. It combines your rate and your occupancy into one figure.
This is yield management applied to vacation rentals. When you start tracking RevPAR, you stop chasing high nightly rates. You start optimizing for total revenue. That shift changes everything about how you price your listing.
How to find Your RevPAR Right Now
- Pull your total revenue for last month. Use your Airbnb earnings page or PriceLabs dashboard. Include all payouts.
- Count your available nights. This is the total calendar days minus any nights you blocked for personal use. Only count nights the listing was open for booking.
- Divide revenue by available nights. That number is your RevPAR. Write it down. Track it monthly. Compare it to the same month last year.
RevPAR also helps you compare properties in different markets. A $150 RevPAR in a small beach town might be better than a $120 RevPAR in a big city, even if the city listing has a higher nightly rate. The metric cuts through the noise and gives you one number to track.
Every decision you make from here forward should be measured by its impact on RevPAR. Did a new photo set increase bookings? Check RevPAR. Did a price drop fill more nights? Check RevPAR. Did a minimum stay change reduce gaps? Check RevPAR. One metric, one truth.
For more on how occupancy fits into this picture, see the occupancy rate breakdown.
How to Find Your Real rivals
Most hosts compare to the wrong listings. They look at the most expensive listing in their area and try to match it. Or they look at the cheapest listing and try to undercut it. Both approaches are wrong.
Your real rivals are the listings guests are actually choosing instead of yours. Those are listings with similar bedroom count, similar guest capacity, similar location, and similar quality. They show up on page 1 and page 2 when a guest searches your market.
Here is how to find them. Go to Airbnb. Search your market with the dates a typical guest would book. Filter by your bedroom count and guest count. Look at the first two pages of results. Those are your competitors.
Look at their prices and their review counts. A listing with 200 reviews charging $180 per night is not your competition if you have 12 reviews. A listing with 12 reviews charging $160 per night is. You compete with listings at your stage, not with established listings that have years of momentum.
The goal is to find the effective rate. That is what guests are actually paying after fees and discounts. Airbnb shows the nightly rate, but guests also pay cleaning fees, service fees, and sometimes weekly or monthly discounts. The effective rate is the total cost divided by the number of nights.
Build a comp set of 5 to 10 listings. Track their prices weekly. Watch how they adjust for weekends, holidays, and slow periods. This is the foundation of your market analysis.
3-Step Comp Set Check
- Search Airbnb as a guest. Use your target dates, bedroom count, and guest count. Screenshot the first two pages of results. Note prices, review counts, and listing quality.
- Calculate each rival's effective rate. Click into each listing. Add up the total cost for a 3-night stay, then divide by 3. That is their effective nightly rate after all fees.
- Repeat weekly. Prices change. New listings appear. Old ones drop off. Your comp set is not static. Update it every week so your base rate stays accurate.
Setting Your Base Rate the Right Way
The base rate is the foundation of everything. PriceLabs, Wheelhouse, and Beyond all adjust up and down from this number. If you set it wrong, every change that follows is wrong too.
Most hosts set it wrong. They set it too high and wait for bookings that never come. Or they set it too low and give away revenue on nights when guests would have paid more. Both mistakes come from the same cause: guessing instead of using data.
Here is how to find your base rate. Look at your comp set's effective rate. Take the average across your 5 to 10 competitors. Then add your market position change. If your listing has better photos, a better location, or more amenities than the average comp, add 10 to 15 percent. If your listing is newer with fewer reviews, subtract 10 percent until you build momentum.
Your base rate is not a fixed number. It changes with the seasons. A mountain cabin in Colorado needs a new base rate in January than in July. Review your base rate every 90 days. Compare it to your comp set's current effective rate. If the market moved, your base rate should move with it.
When I set up PriceLabs for a host, I usually drop the base rate 7% and drop the floor price 15%. Then I apply a far out price increase to offset it. The base rate is not your price. It is your anchor. PriceLabs moves your actual price up and down from that anchor based on demand, day of week, and seasonality. Give it room to work.
Base Rate Setup Checklist
- Calculate your comp set average effective rate. Use the 3-step comp set check from the previous section.
- Add your position change. Better than average = add 10-15%. Worse than average = subtract 10-15%. Be honest.
- Set your floor price 15% below your base rate. This gives PriceLabs room to drop on slow nights without going too low.
- Set your maximum price 40-60% above your base rate. This caps how high PriceLabs can go on peak demand days.
Set your listing to $9,999 per night when you first publish. This protects you from a cheap booking before you have set up your pricing properly. Change it within the first day once your dynamic pricing tool is connected and configured.
The Three Pricing Zones: The Core of STR Revenue Management
This is the core of airbnb revenue management. Your calendar is not one block. It is three distinct zones. Each zone needs a new plan. Most hosts treat every date the same. That is the biggest pricing mistake you can make.
Zone 1: Far Future (150+ Days Out)
Nobody should be booking this far out at your regular rates. If someone books 6 months ahead at your standard price, you are almost certainly underpriced for that date. Apply a large premium here.
In PriceLabs, set a far out floor price. Weekday floor: $140 to $160. Weekend floor: $160 to $200, depending on your market. Add a 400% far out flat rate for protection. If someone still books at that price, great. You got a premium rate.
Zone 2: Medium Range (45 to 150 Days Out)
This is where your plan lives. Apply a gradual far out price increase starting at 60 days. A 50 to 95% premium over 500 days works for most markets. You want bookings here, but at a price you are happy with.
This zone is where you build your calendar. Most of your revenue comes from bookings made 2 to 4 months ahead. Price it right and your calendar fills steadily without discounting.
Zone 3: Last Minute Fight Zone (0 to 45 Days Out)
Apply a 15 to 20% last minute discount inside 45 days. This is where you compete for the guest who is booking soon. Sean teaches in his Cracking Superhost coaching sessions that 45 days is where your dog fight starts. Here you compete on price, photos, and reviews.
Do not apply your monthly discounts globally. Set them as a rule set in PriceLabs. A global monthly discount will compromise your last minute rates. That is the most common mistake I see. The guest booking a 30-day stay at the last minute gets both the monthly discount and the last minute discount. You lose twice.
Zone 1 (150+ days): +400% flat rate protection. Zone 2 (45-150 days): +50-95% gradual premium. Zone 3 (0-45 days): -15-20% last minute discount. Each zone has a new job. Far future protects you. Medium range builds your calendar. Last minute fills your gaps.
For a deeper look at how dynamic pricing tools handle these zones, see the full dynamic pricing guide.
How to Use Events and Demand Spikes
Market demand changes by the day. Events create spikes. Off-season creates valleys. Your pricing needs to respond to both. A flat rate ignores all of this.
How to find demand data: PriceLabs has a Neighborhood Data tab. It shows occupancy by day for your market. When you see a date where market occupancy is climbing fast, that is an event or a demand spike. Your pricing should reflect it.
Here is the event strategy. When you see a spike coming, raise your floor price for those specific dates. Do not let PriceLabs drop you below your floor on a high-demand date. The tool adjusts based on algorithms. You adjust based on local knowledge. Both matter.
I coached a host whose market had a Constitution Day event. The market was 67% occupied on those dates two months out. He had availability. His rates were flat. We raised his minimum for those dates and he picked up the booking at 40% above his normal rate. The data was right there in PriceLabs. He just had not looked.
Pickup rate matters more than current price. When 10% of your market is booked 6 months out and you already have a booking, your rates are probably right. When 10% is booked 6 months out and you have nothing, something is wrong. The pickup rate tells you whether your prices match the market's booking speed.
Check your market's event calendar monthly. Sports events, concerts, festivals, conferences, and holidays all create demand spikes. Set date-specific minimums for each one.
PriceLabs Market Dashboard shows market-level demand data alongside your own calendar. It tracks occupancy trends, revenue averages, and seasonal patterns for your specific market. Key Data Dashboard is a second tool worth checking. It pulls direct data from 65+ property management systems, which makes its benchmarks more accurate than tools that rely only on scraping. The hosts who earn the most are the ones who see the spike before it hits.
Do not forget about negative events. A major employer closing, a new STR regulation, or a seasonal slowdown can all reduce demand. When you see a valley coming, lower your minimums early. It is better to fill a night at a discount than to leave it empty. For more on building a pricing calendar around events, see the pricing strategy 2026 guide.
Length of Stay: The Hidden Revenue Lever
How long guests stay affects your revenue more than most hosts realize. Every turnover costs money. Cleaning, restocking, wear and tear, and the gap between checkout and check-in all add up. Short stays have higher costs relative to revenue. Long stays reduce turnover but can lock out better bookings.
The right minimum stay plan depends on your booking window and your guest type. A beachfront property attracts 4 to 6 night stays. A city apartment attracts 2 to 3 nights. Work with your natural stay length, not against it.
Your listing has a natural stay length that matches your guest type. A beachfront property attracts 4 to 6 night stays. A city apartment attracts 2 to 3 nights. A cabin in the mountains attracts weekend warriors (2 nights) and week-long vacationers (7 nights). Look at your past bookings. Find your natural pattern. Then build your pricing around it.
Here is how to price by length of stay. For 1 to 2 night stays, add a 15 to 20% premium. These are your most expensive stays per dollar earned because cleaning costs are spread over fewer nights. For 3 to 6 night stays, charge your base rate. This is your sweet spot. For 7 to 13 night stays, subtract 10%. For 14 or more nights, subtract 15 to 20%.
Do not let someone book a 1-night stay in Zone 1 far future. You will regret it when a 4-night booking shows up and your calendar is fragmented. Set your minimum stay higher for far-out dates. Drop it as the date gets closer.
Calendar fragmentation is a silent revenue killer. A 1-night booking on a Friday creates a gap on Thursday and Saturday that is hard to fill. Now you have lost two nights instead of gaining one. The right minimum stay prevents this. In most markets, a 2-night minimum is the floor. In resort markets, 3 nights is safer.
Track your average length of stay monthly. If it is dropping, your calendar is getting fragmented. If it is rising, your LOS plan is working. This number should trend upward over time as you fine-tune your settings.
LOS Settings in PriceLabs
- Set minimum stay by booking window. 150+ days out: 3-night minimum. 45-150 days: 2-night minimum. Under 45 days: 1-night minimum (if your market supports it).
- Add length-of-stay discounts as a rule set. 7+ nights: 10% off. 14+ nights: 15-20% off. 28+ nights: 20-25% off. Apply these as rule sets, not global discounts.
- Add a short-stay premium. 1-night stays: +15-20% above base rate. This covers your higher per-night cleaning cost and turnover time.
For a full breakdown of minimum stay strategies, see the minimum stay strategy guide.
Common Mistakes That Kill Revenue
These mistakes are not obvious. I see them on listings managed by experienced hosts with dozens of five-star reviews. The mistake is not in the listing. It is in the pricing setup.
6 Revenue Management Mistakes to Fix This Week
- Setting base rate too high and waiting for bookings. A high base rate with low occupancy means low RevPAR. Drop your base rate 7% and let your dynamic pricing tool fill more nights.
- Using global monthly discounts. A global discount compounds with your last minute discount. Set monthly discounts as a rule set in PriceLabs, not a global setting on Airbnb.
- Ignoring the booking pace for your market. If your market is 40% booked for next month and you have zero bookings, your prices are too high. Check PriceLabs Neighborhood Data weekly.
- Not setting a far out price floor. Without a far out minimum, PriceLabs can drop your rate to fill a date 6 months away. Set a weekday floor of $140 to $160 and a weekend floor of $160 to $200.
- Using the same minimum stay for far future and last minute. A 3-night minimum makes sense for dates 5 months out. It does not make sense for a date 3 days away. Drop your minimum stay as the date approaches.
- Tracking ADR instead of RevPAR. ADR hides your vacancy problem. A $250 ADR at 50% occupancy is worse than a $180 ADR at 80% occupancy. Track RevPAR monthly.
These are not beginner mistakes. I see them on listings managed by experienced hosts with dozens of five-star reviews. The mistake is not in the listing. It is in the pricing setup. Fix these six things and you will see your RevPAR climb within 60 days.
Free Tool
Get Your Free STR Revenue Audit
Work through these 7 steps using only your Airbnb dashboard. Each one takes 2 to 3 minutes. Check the box when done. Your answers are saved in your browser.
0 of 7 completeYou have your baseline.
If any of these steps showed a gap, that is exactly what Revande fixes. We set up your pricing system, manage your zones, and track your RevPAR every month. You focus on guests. We focus on revenue.
Work With Revande → Or keep going on your own. Everything you need is in this guide.New videos every week on Airbnb strategy, market analysis, and automation.
Common Questions: Airbnb Revenue Management
What is Airbnb revenue management?
Airbnb revenue management is the practice of selling the right room, to the right guest, at the right price, at the right time. It uses data on demand, competition, and booking pace to adjust your nightly rates. The goal is to maximize total revenue across your entire calendar, not just your nightly rate.
What is RevPAR and why does it matter for Airbnb hosts?
RevPAR stands for Revenue Per Available Room. You calculate it by dividing your total revenue by the number of nights your listing was available, not just the nights it was booked. RevPAR matters because it accounts for both your nightly rate and your occupancy. A host charging $300 per night at 40% occupancy earns less than a host charging $180 per night at 75% occupancy.
What is the best dynamic pricing tool for Airbnb?
PriceLabs is the most widely used dynamic pricing tool for Airbnb hosts. It offers neighborhood data, customizable rule sets, and far out pricing controls. Wheelhouse and Beyond Pricing are solid alternatives. The best tool is the one you actually learn to configure properly. A poorly configured PriceLabs account will underperform a well-managed Wheelhouse setup.
How do I set my base rate on PriceLabs?
Start by building a comp set of 5 to 10 listings similar to yours. Look at their effective nightly rate after fees and discounts. If your listing is above average in quality, add 10 to 15% to the comp set average. Then set your PriceLabs base rate to that number. Drop your floor price 15% below your base rate to allow PriceLabs room to adjust for low-demand dates.
What is the difference between ADR and RevPAR?
ADR (Average Daily Rate) is the average price per booked night. RevPAR (Revenue Per Available Room) is the average revenue per available night, including unbooked nights. ADR ignores vacancy. RevPAR does not. A host with a $250 ADR and 50% occupancy has a RevPAR of $125. A host with a $180 ADR and 80% occupancy has a RevPAR of $144. The second host earns more money. RevPAR is the better metric because it reflects your actual income.
Sources
- Beyond — State of Revenue Management in Short-Term Rentals 2025. beyondpricing.com
- Key Data Dashboard — STR Benchmarking and Market Intelligence (700,000+ properties). keydatadashboard.com
- Guesty — Short-Term Rental Industry Report 2024. guesty.com
- National Short Term Rental Association — Dynamic Pricing Tools and Industry Data. nationalshorttermrentalassociation.com
- Airbnb Host Resource Center — Official Hosting Guidance and Policies. airbnb.com
- Rentals United — Dynamic Pricing Research and STR Channel Data. rentalsunited.com
| Framework | Focus | Link |
|---|---|---|
| Pricing Zones | Calendar-based pricing by booking horizon | Read more |
| ADR Rulesets | Conditional pricing rules for software | Read more |
| The Conversion Equation | Diagnosing views vs conversion problems | Read more |
| The Ramp-Up Phase | New listing launch strategy | Read more |
| RE:Algorithm | Airbnb algorithm mastery | Read more |
| Target Price | Math-based nightly rate system | Read more |
| Pricing Masterclass | Complete pricing system (13 modules) | Read more |
| BIG DATA | Market research before investing | Read more |
| Cracking Superhost | Flagship A-to-Z coaching (7 coaches) | Read more |
| Closers Crash Course | Landlord negotiation for arbitrage | Read more |
About the Author
This analysis is by Sean Rakidzich, an 11-year short-term rental operator who manages 155 Airbnb properties generating $1M+/month in revenue. Sean has trained 5,000+ students across 76 countries with $1.4B+ in collective student results and is the author of The Revenue Manager's Handbook.
For Sean's framework on Airbnb revenue management, which focuses on RevPAR rather than ADR, can lead to a 22% revenue increase for hosts who adopt the system, see his full content library at rakidzich.com or book a 30-minute strategy session at rakidzich.com/book.
Affiliate disclosure: Some links on this page (anything starting with rakidzich.com/p/) are affiliate links. If you sign up through them, Sean may earn a commission at no extra cost to you. The recommendation reflects Sean's actual use across his 155-property portfolio.